

1. Setting up cluster policies
Let’s start with cluster policies. Policies are a tool that workspace admins can use to prescribe compute settings and apply limits and rules. It’s essentially a set of rules that prescribes what compute settings users can choose when they spin up a cluster.
Policies provide the following benefits:
- Limit users to creating clusters with prescribed settings.
- Limit users to creating a certain number of clusters.
- Simplify the user interface and enable more users to create their own clusters (by fixing and hiding some values).
- Control cost by limiting per-cluster maximum cost (by setting limits on attributes whose values contribute to hourly price).
- Enforce cluster-scoped library installations.
These are configured by workspace admins under Compute, then Policies, in the Databricks workspace.
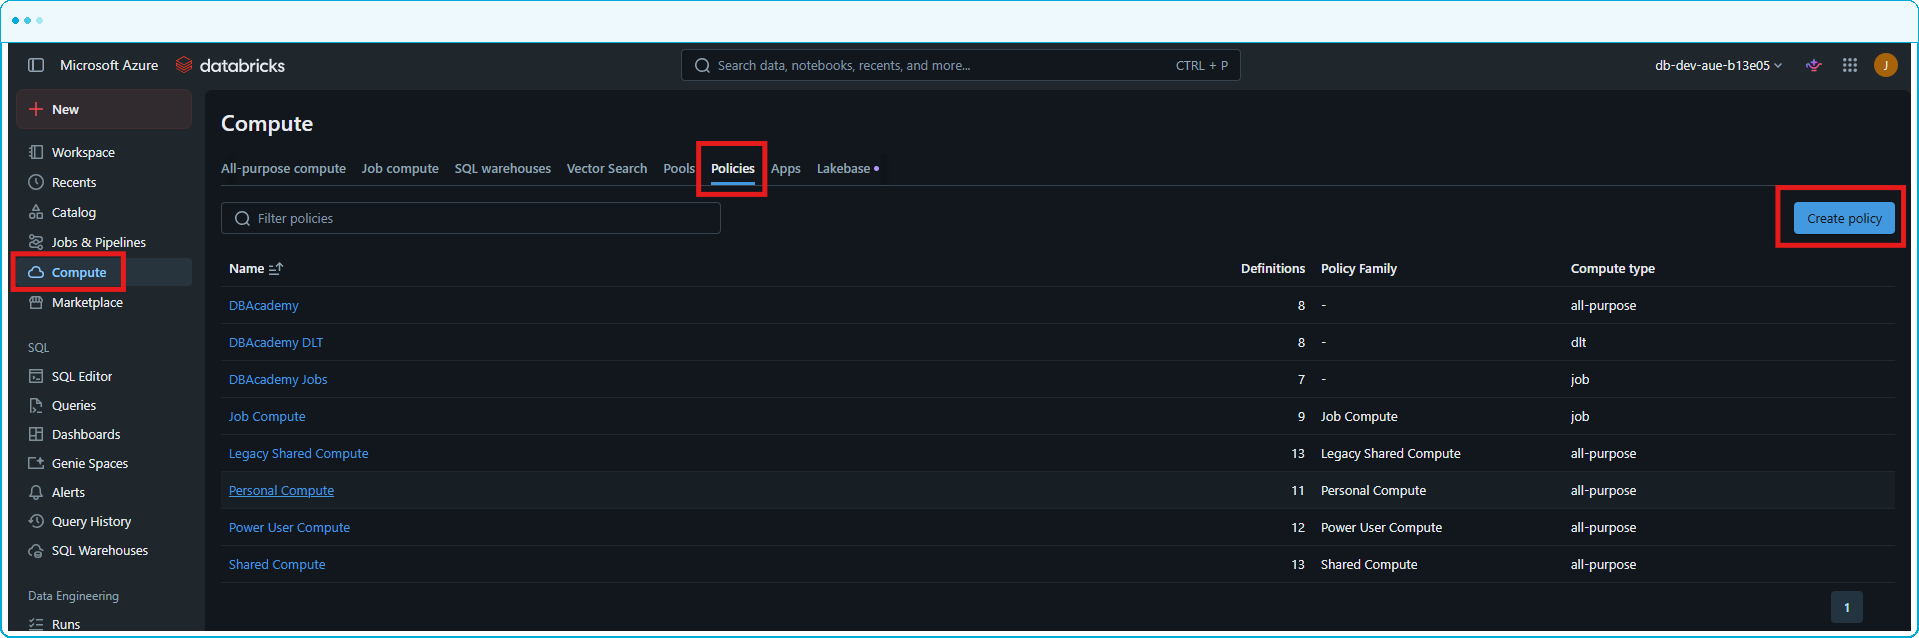
Start by creating a name for your new policy. Policy names are case-insensitive so be aware of this when naming your policies. Cluster families are premade templates provided by Databricks with prepopulated rules for common compute use cases.
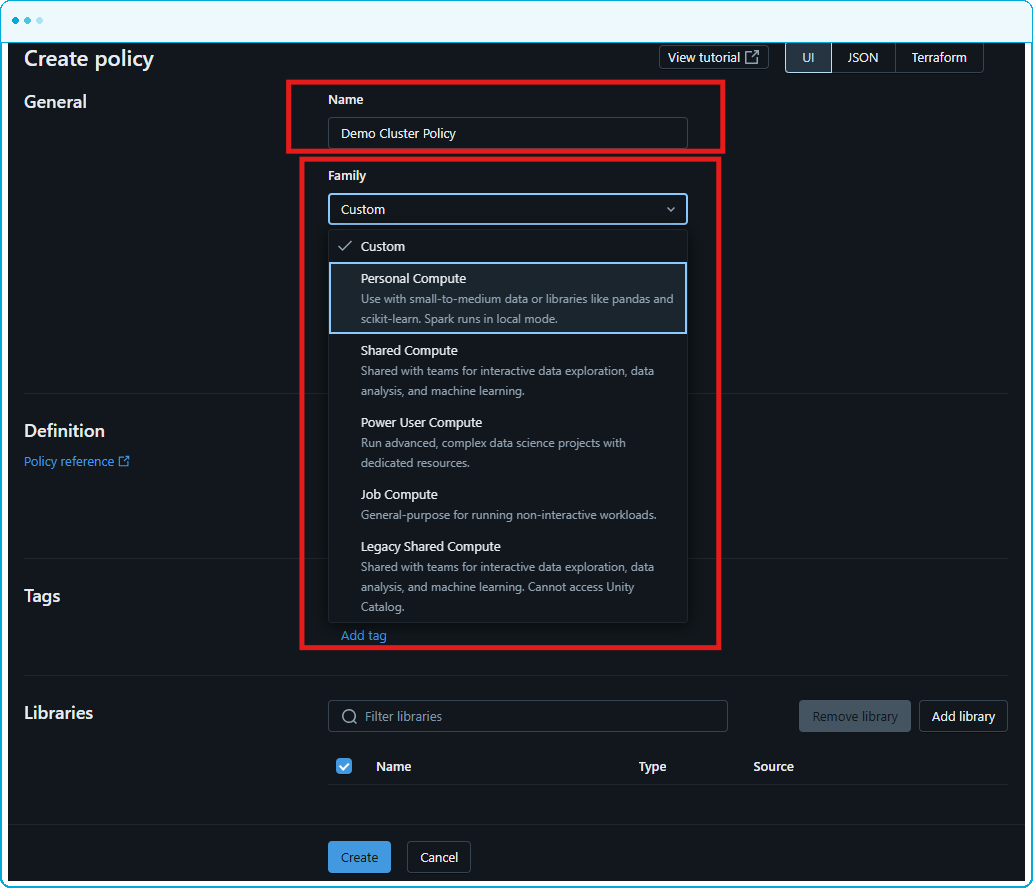
Next specify the cluster type under the advanced options. This defines the types of compute that can be created using this policy: all-purpose to run notebooks, job compute for running jobs, and SDP (spark declarative pipelines) for running pipelines.
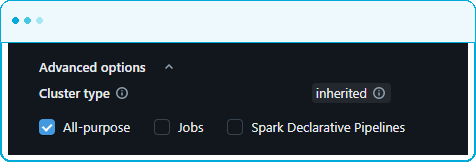
We can cap the number of clusters a user or group can run concurrently as well as DBU’s (Databricks Units) a compute created by this policy can consume. This helps prevent situations where users forget they have left multiple clusters running.
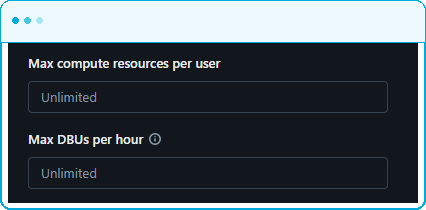
Add a policy definition which defines the constraints for a selected property, for instance, limiting the spark version.

Next add a compute tag. These tags can be used in attribute-based access control (ABAC) and enable accurate reporting.
Libraries can be added that will automatically be installed on any compute resource created with this policy. Useful for governance, security agents, or shared utility packages. We will see the usefulness of tags in action soon when we query the system tables.
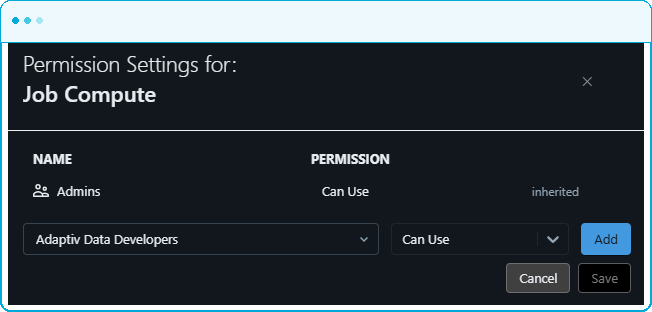
Finally in the permissions setting can you can choose people or groups who are allowed to use your policy once it has been created.
Databricks recommends using compute policies. A good idea is to create a set of policies for different users, a general analytics policy, a data engineering policy etc, each configured for their appropriate use case and needs and assign them to the appropriate user groups. This way each group has the right resources they need to achieve their goal without going overboard.
The takeaway: cluster policies stop overspend before it happens. They provide a practical way to manage compute usage because they prevent the bill from being incurred in the first place.
Reference:
Create and manage compute policies — Databricks on AWS
2. Configuring cost alerts and budgets
Budgets are configured at the account level, not the workspace level, so this requires the account admin role. You’ll find budget alerts in the account console under Usage, then Budgets.

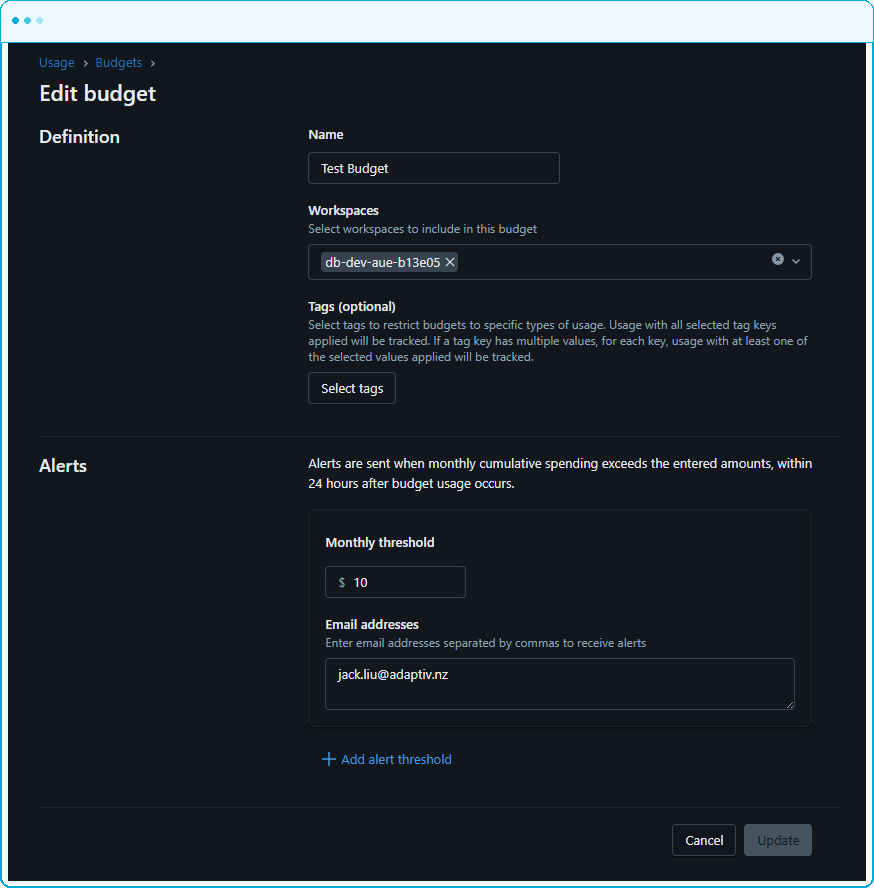
The benefits for budgets are straightforward: budgets monitor spend against thresholds we define and notify the right people when defined thresholds are exceeded. Databricks emails designated recipients when spend exceeds the set monthly threshold.
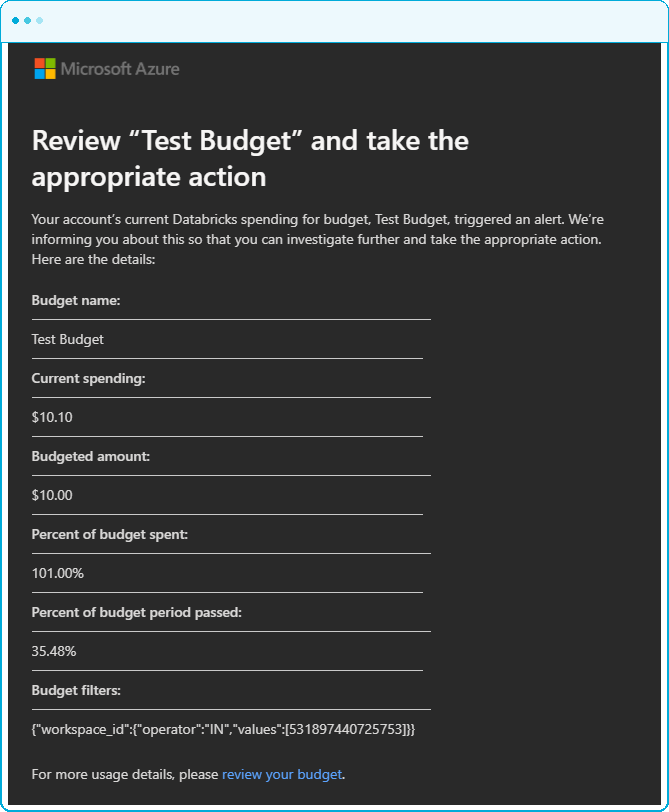
Here is an example email sent out for a budget alert named “Test Budget” alert notifying that the spend has exceeded the set limit of $10.
A few things make this particularly useful. We can apply tags to budgets, so a budget can be scoped to a specific business unit, project, or environment by matching the tags we’ve already applied to our workspaces and clusters. Again, we will see the usefulness of tags in action in the next section.
3. Querying system tables for cost analysis
Now we move from prevention and detection into analysis.
System tables are a collection of read-only tables, governed by Unity Catalog, that contain operational telemetry across the account. Account admins have access by default; for everyone else, we grant USE and SELECT on the relevant system schemas.
The data lives in the system catalog, stored in a Databricks-hosted storage account in the same region as our metastore, and shared to us via Delta Sharing.
High-value tables for cost analysis
system.billing.usage gives us per-record billing data. Every billing record includes columns that attribute the usage amount to the specific resources, identities, and products involved. Databricks documentation provide a complete reference of the usage tables.
We can write SQL to leverage the system tables and answer questions like: which jobs are driving the highest spend this month? Or how much are specific tagged objects costing?
Here are two example queries that showcase some uses of the system tables.
This first query shows DBU usage broken down by SKU for every object tagged with aidevkit_project: JackLiu.
SKUs (stock keeping units) are the identifiers Databricks uses for its billable products and services, so each SKU represents a specific compute or storage product on the bill.
In this example where the AI Dev Toolkit is being tested, the toolkit automatically applies the aidevkit_project tag to every object it creates. Because of this tag, we can see exactly how much DBUs are consumed by objects created by the toolkit, broken down between the job compute and the serverless compute it spun up.

This demonstrates the real value of tagging: it lets us attribute cost to specific projects, teams, or workloads, which is essential for cost management and governance.
This second query shows how much a Job has costed in DBU units. In this example we can see how much the Job created by the AI devkit has costed.

We can see that my test job “Copy devkit_test to devkit_test 2” has costed a total of 0.3 DBUs.

The takeaway: system provide a queryable dataset we can interrogate, attribute, and act on.
Reference:
System tables reference — Databricks on AWS
4. Building a practical cost dashboard
Databricks provides prebuilt usage dashboards out of the box. Account admins can find them in the account console under Usage, then Consumption and import them to a Unity catalog enabled workspace.

The current latest version is the Usage dashboard V2. Once imported from the account console they will show up under dashboards in the Databricks workspace.

The benefit of starting with the prebuilt dashboard is that we get value immediately with little setup. Under the hood the usage dashboard visualises information from the system tables in a visual dashboard and by default shows usage breakdowns by product, SKU name, and custom tags. It also contains analysis of the most expensive usage source.

But the prebuilt dashboard is just a starting point. Because the underlying data lives in system tables that we discussed before. We can easily update the datasets that power the dashboard, adding new datasets to support any new widgets we want to create. Databricks continues to update and add to the usage dashboard so make sure to refer to the docs for the latest version and update notes. Creating fully custom dashboards takes effort and the preconfigured usage dashboard v2 is a great place to start with a solid foundation on visualising your Databricks costs without requiring the upfront effort to build dashboard from scratch.
The takeaway: Databricks usage dashboard V2 is a ‘quick to setup’ dashboard that helps visualise costs with minimal effort required, while also providing a solid starting point to customise and build upon to meet each user’s unique requirements.
Reference: Usage dashboards — Databricks on AWS